


How do you pay for it? (pt. 2)
Accounting for a $20 trillion leftist paradise (the revenue part)

In part one, I outlined the things a leftist paradise includes. All the things seem pretty great! Free college, free healthcare, $2,000 per month in Universal Basic Income, etc. Poverty is all but extinct, and inequality falls to a level that makes egalitarians across the world smile, but now we get to the ‘hard’ part. The answer to the question of this series—how do we pay for it?
The Spending | $19.9 trillion total | 67.0% of GDP total
This is the spending we have to cover, and 67% of GDP isn’t a trivial amount of money to raise, so let’s get started with some caveats:
There is a diverse set of ways to fund these programs. The path I outline is one that attempts to outline the most efficient, pro-growth ways to raise the trillions needed to fund leftist priorities.
Estimating revenue from taxation and government institutions is a complex, thorny, imperfect process. The strongest claim I will make is that it’s, indeed, possible to raise the amount of revenue above without destroying the economy’s ability to grow and innovate.
The funding mechanisms mentioned in this article aren’t the only taxes a leftist paradise will have (and I’ll speak about this at the end), but they’re the main taxes required to fund the bulk of the paradise.
The funding mechanisms, as with the imagined spending, are an ideal set of circumstances. I’m sure in real life enacting any of these things would be complicated, prolonged, and not completely ideal. The point of this article is only to show that if we had the political will, we could enact an egalitarian set of reforms without destroying the economy.
With that said, let’s get started.

Expenditure Tax | $6.5 trillion | 21.6% of GDP | $13.4 trillion deficit
A giant makes its return: the expenditure tax. I wrote about this tax in the first part of my left tax series, and for good reason. The expenditure tax raises significant revenue without distorting investment decisions relative to our current tax code. Considering it abolishes both the income tax and capital gains tax, this tax results in more/similar levels of investment and, therefore, both more/similar levels of jobs and innovation in the economy.
The way it works is, by mechanism, similar to the income tax, with some important caveats. All payments a person receives go into two categories: (1) consumption or (2) investment. When a person receives a payment, they either consume the payment by buying things, or they save/invest the money for later use.
Any individual who receives payments throughout the year, either through wages, gifts, benefits, capital income, etc., will file taxes as we do now, but under the expenditure tax, all investment is tax-deductible, meaning the expenditure tax only taxes final consumption each year.
The advantage of an expenditure tax over a VAT or sales tax is that we can make the rates on consumption progressive, raising more revenue and redistributing more money from the richest to the poorest. It’s important to note that a VAT and an expenditure tax could work in tandem, since we might not expect perfect compliance with an expenditure tax (i.e., people underreporting consumption or overreporting investment).
If there are compliance concerns with the expenditure tax, especially since the bottom 20% have an income less than their consumption, we might consider a basic VAT of 25% with a progressive expenditure tax on top to ensure broad-based funding.
Now, let’s walk through the revenue estimate by explaining the chart below.

I take the expenditure data by decile from the 2023 Consumer Expenditure Survey and boost it by 4% to adjust to 2024.
I include the Universal Basic Income and Child Allowance programs from part one because they’re also taxed (since they’re used for consumption). This also helps illustrate both the difference taxing benefits makes in raising revenue and the benefits’ net effects on consumption.
In order to derive the tax on benefits for each decile, I include a ‘consumption ratio.’ The ‘consumption ratio’ is the ratio of consumption to investment. For instance, if someone has an income of $1,000 and they consume $500, their consumption ratio is 50%. I do this in order to approximate the taxes on the UBI and Child Allowance. If the poor consume almost all of their benefits (i.e. close to a 100% consumption ratio), the proportion of their benefits that’s taxable is higher than a wealthy person who saves most of their benefit money.
*Note, I don’t include transfer payments from disability, social security, or unemployment. Assuming a similar weighted average tax rate to the deciles in the above chart, this would raise an extra $100+ billion.
After including this information, I construct a tax bracket for the expenditure tax and multiply the rate by the total expenditure within each decile. I then take the bracket rate, the UBI and Child Allowance amounts, the consumption ratio, and multiply them together. I add the benefit tax and expenditure tax together to derive final revenue.
The expenditure tax here is a broad-based tax, benefits are taxed, and the proportion of taxable benefits of the poor is higher, but that doesn’t mean the poor aren’t radically better off under this system.

To illustrate this, I created the above chart. This chart has the exact same process above, but for the average person within each decile. Walking from left to right, we see the average expenditure in each decile, their tax burden, average benefits, average benefit taxation, and their net-expenditure.
Their net-expenditure is the expenditure for the individual after accounting for all taxes and transfers. Let’s chart this change relative to today’s distribution of consumption:

The red consumption distribution is much more compressed than the current blue distribution. Under this set of policies, the bottom 70% of people consume more, and the top 30% of people consume less.
It’s important to note that in the leftist paradise, consumption is even more egalitarian with boosted funding for public services like education, transit, and media. I also wouldn’t predict the consumption tax here to decrease growth since this is a redistribution of consumption from one group to another, where the richest individuals pay taxes to support a system of distribution from themselves to the bottom deciles.
Another way to think of this is that the government isn’t actually producing anything with the tax money it transfers to others for consumption. This money re-enters the economy each time a person spends it.
One could argue that the richest people will pull investments to maintain their lavish consumption, but then we’d have to compare the productivity gains from abolishing poverty (especially childhood poverty) relative to a structural decrease in investment. There is also reason to think that increasing taxes over a medium to long-term period of time decreases the effect taxes have on growth, so we should consider this when planning for any ideal system.
Taxes always have some deadweight loss, but the total elimination of both taxation on investment and poverty likely have net positive growth implications (more on that later) in addition to a more egalitarian distribution of consumption.
Payroll Tax & Premiums | $4.9 trillion | 16.5% of GDP | $8.5 trillion deficit
Let’s move to healthcare, the second largest single item in our leftist utopia. Countries fund their healthcare systems in a variety of ways, but let’s focus on two main ways for the purposes of this exercise—payroll taxes and premiums.
A payroll tax funds a significant portion of many of the largest healthcare systems in the world, including the U.S.’s Medicare system. However, we’re talking about a very large expansion. Not only are we providing everyone Medicare, we’re doing so at little to no cost at the point of service.
The payroll tax, in order to fund such an expansive health benefit, would need to be north of 30%. On a similar plan, a model from the Wharton Business School shows a decrease in output of 3% when financing Medicare for all with a payroll tax.
However, the same model shows financing Medicare for all with premiums increases GDP by 16%. For reference, present-day Medicare partially finances itself by charging premiums. Premiums are better for growth, in part, because, by putting a tax on labor income, the government provides a marginal disincentive to work. By contrast, a flat premium charged to everyone, despite hours worked, doesn’t impose a work disincentive, so what if we used premiums as well?
Let’s amend the expenditure tax section’s chart to include a flat premium for each adult ($500 per month per adult). This reduces expenditure tax revenue by ~$340 billion, but adjusting expenditure tax rates could make this up.
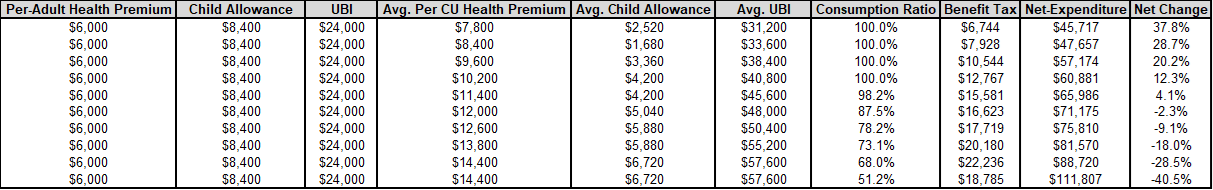
Taking the per-person health premium (essentially a head tax), adding in UBI and Child Allowance, and subtracting all taxes, I arrive at the new, premium adjusted, net-expenditure. Even under a partial head tax, the bottom 50% are better off compared to the top 50%. This is comparable to the distributional results of our current income tax, where the median person pays a small amount into the system, the top pays much more, and the bottom are net-beneficiaries.
Premiums lower the payroll tax burden, at the cost of distributive impact. For reference, the combined payroll tax in the U.S. on labor is already over 15%, so there’s no clear correct answer here. In practice, there would likely be a mixture of payroll tax financing and income-adjusted premiums charged to each adult, and although I don’t imagine we’d ever want to charge children for their health insurance, I’ve seen crazier proposals.
That’s how we reach a world with a universal healthcare system, with respect to growth and equality. I’m not stubborn about the mix between payroll taxes and premiums (head taxes) because, in this world, everyone receives more than enough benefits to cover the costs.
So now that we’ve abolished adult and childhood poverty, while also providing everyone with healthcare, let’s move on to everything else.
Land Value Tax | $4.5 trillion | 15.1% of GDP | $4.0 trillion deficit
Oh, the land value tax, how I wish you were a thing. Not only do you raise a lot of revenue, but you also cause the opposite of deadweight loss! Land can’t leave when you tax it, and because you tax away economic rents, the economy grows even more.
I wrote about the land value tax a couple of weeks ago, where I derive the $4.5 trillion figure by taking the percentage of GDP raised from a land value tax Lars Doucet estimated in 2019 and apply it to 2024’s GDP. This might be an overestimate by a few hundred billion dollars, but as we’re about to see, this isn’t too big a deal.
Destination-Based Cash Flow Tax | $1.5 trillion | 5.0% of GDP | $2.5 trillion deficit
I also wrote about the DBCFT a few weeks ago. The great thing about a DBCFT is that it raises a ton of revenue from the supernormal returns of corporations without distorting trade. You can think of it like a corporate income tax where corporations can deduct the full cost of investments (‘full expensing’ rather than relying on depreciation). Imports are taxed, exports aren’t, and corporations can’t deduct interest from their taxes (as they can now).
There is an IMF paper about the revenue impacts of a DBCFT for several countries that shows a DBCFT could raise 5% of GDP in revenue, or around $1.5 trillion in 2024. Not only does the import tax/export subsidy not affect trade flows, full expensing alone raises GDP by over 5%.
Sovereign Wealth Fund Income | $4.1 trillion | 13.8% of GDP | $1.6 trillion surplus
Finally, we come to the GOAT—Sovereign Wealth Fund. A sovereign wealth fund is a diversified pool of assets owned by the public (rather than private shareholders). The public can invest in capital and build its fund through any number of mechanisms.
For instance, if, since quantitative easing took off in the U.S., the Federal Reserve invested in a diversified pool of assets, rather than only debt securities, and it transferred these assets to a SWF, the U.S. would have a sovereign wealth fund worth well north of $10 trillion, all without charging any taxes.
Of course, it’s likely the U.S. would use some sort of tax revenue to pour into the fund over time. I like the idea of taxing part of land rent and resource rents to fund a sovereign wealth fund, but the exact tax used doesn’t matter as much for the purposes of this exercise. What matters is an ideal SWF’s potential.
To put the potential of a SWF in perspective, Norway has a SWF worth a little over $300,000 for every single Norwegian at the time of writing. If the U.S. boosted this to $400,000 per American and pulled 3% of this into a general revenue fund, the U.S. could raise $4.1 trillion annually. Assuming an ideal institutional framework (this is paradise after all), this radically reduces wealth inequality while raising a ton of money for the public good.
Closing Thoughts
Total Revenue | $21.5 trillion | 72.3% of GDP | $1.6 trillion surplus
And with that, we’ve raised revenue enough revenue to cover our paradise with a healthy surplus on top. In practice we could use this surplus to lower taxes on things like consumption and payroll or role it into the SWF for additional capital income.
Not including the SWF capital income, taxes as a percent of GDP are around 58.5%. If we take out the land value tax (since it only taxes economic rents, leading to no distortions), the expenditure tax, payroll tax, premiums, and DBCFT total around 43.4% of GDP. These taxes would place the U.S. at the higher end of taxes as a percent of GDP, but they would do so as the most efficient tax system in the world.
Many of the cost assumptions in part one of this series are generous. It’s likely that with a more fitted proposal, costs like the military budget could reduce. Since we’ve also achieved fiscal balance, we wouldn’t need to spend over $1 trillion a year on interest payments going forward, allowing us to reduce the tax burden even more.
One could say it’s a little silly to assume in year one we could fund a SWF the size of Norway, and I agree. All the changes described in both parts of this series are not likely to happen in a single year. They’re each generational battles, hopefully with more steps forward than back over time. Maybe we start with a 1% land value tax, or a small UBI reform as described in my tax expenditure article.
This article also exists in a vacuum, and the revenue estimates here aren’t an academic exercise. There’s complication and nuance to program cost and tax revenue estimates, but the exact tax bracket isn’t as important as understanding what’s possible.
This is a world without trade barriers, without an income tax, high state capacity, turbo-YIMBYism, and before taxing away all externalities (both higher revenue and pro-efficiency). This is a society, yes, with substantially higher taxes as a percent of GDP, but it’s also a society with a radically efficient tax code, and a tax code that increases growth, incentivizes investment, and spreads consumption to all.
Rent seeking, wealth inequality, income inequality, poverty, and destitution are all either greatly reduced or all but eliminated. People at large, and the left especially, should not let large numbers scare them. These numbers have a story, and the story is worth fighting for.
(58.5% - 43.4%) ÷ 58.5% ≈ 26%
So then, AQTCOR: A Quarter of Taxes Come Out of Rents?
Maybe i’m just lost but wouldn’t using this expenditure tax just allow people to hide extra income in investment? Also it could be hard to determine some spending as investment or consumption, like buying a house, or education?