
What makes people poor?
A look at the issue using 24 years of personal financial data

While writing my ‘Born Poor’ review, I started on a tangent comparing my income level to the children in the documentary when I was their same age. I wanted to investigate how poor or rich I really was during childhood, and compare that to how poor/rich I felt both at the time and as an adult looking back. This turned into a very long tangent, so I decided to put it on the shelf and write it as its own article.
In doing this, I learned a lot about my lot in life. My experiences mirrored some of the biggest drivers of household poverty, and it wasn’t so much about the pay of the adults in my life.
How poor/rich did I feel?
I’m not sure what percentiles I would’ve used if asked how rich or poor I was before this exercise, but generally speaking I felt the following ways about my relative income level at the following ages:
Ages 0 to 5 — I didn’t have much conception of how rich or poor I was at this stage. As an adult, I would’ve said I was “poor” during these ages.
Ages 6 to 11 — I would’ve said at the time and as an adult that I was “poor” at these ages.
Ages 12 to 21 — I would’ve said at the time and as an adult that I was “poor” at these ages.
Ages 22 to 23 — I would’ve said at the time and as an adult that I was “very poor” at these ages.
Age 24 — I would’ve said at the time and as an adult that I was “doing okay,” with some thought that I was doing around the 50th percentile.
I include this because I wasn’t paying attention to the data at any of these ages, and since I didn’t have a dataset of my friends’ and families’ household incomes, the feeling of ‘poor’ or ‘rich’ was just that, a feeling. Once I looked at income data for Americans and combined that with an investigation into my household income at each age, I learned a lot about just how poor or rich I really was.
How poor/rich have I been?
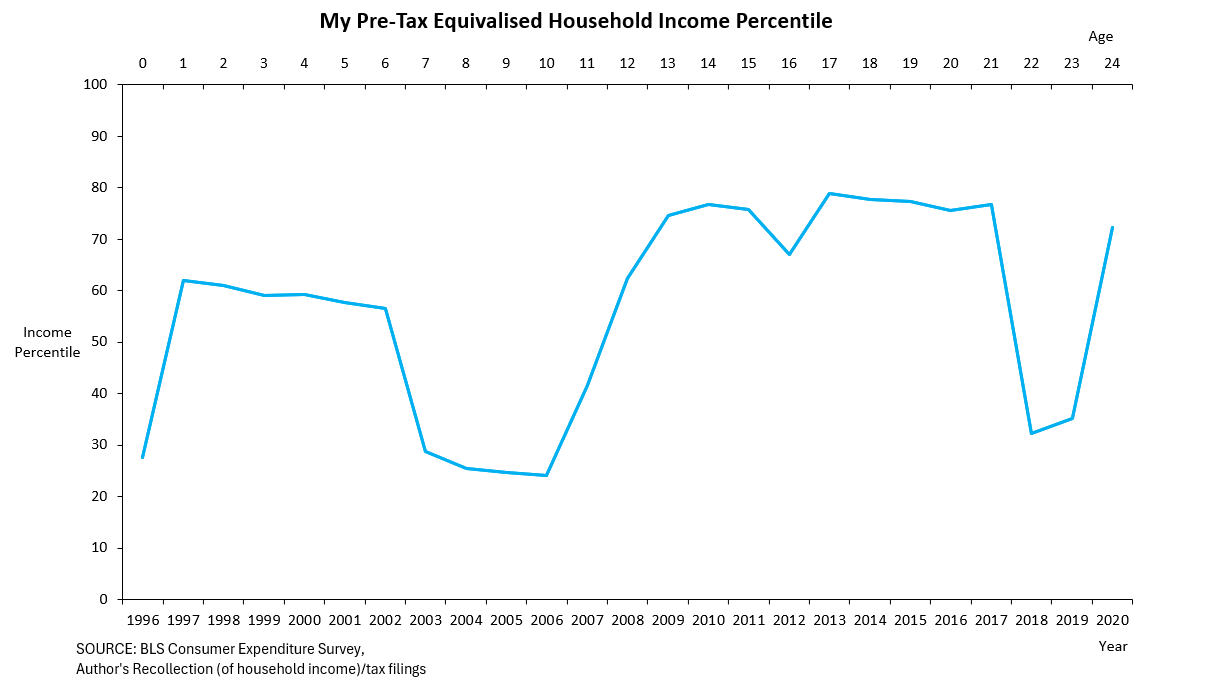
I created this chart, mapping my equivalized household income percentile. This metric roughly tracks how much income the household has when adjusting for household size, since larger households require more money. I compared my historical information to Americans at each decile to get my household’s income percentile. This proxy of poverty/wealth tells me that when I was born, I was in the ~28th percentile, meaning I was in the bottom 28% of American household income (equivalized).
The full chart’s results surprised me, making me think a lot about my upbringing. “How could we have been in the 60th percentile in my early childhood? I thought we were poor!” Similar thoughts occurred for when I was 12 to 21. The distance between my perception and reality during these ages started clearing up when I began noting the cause for each major swing in my household income percentile.
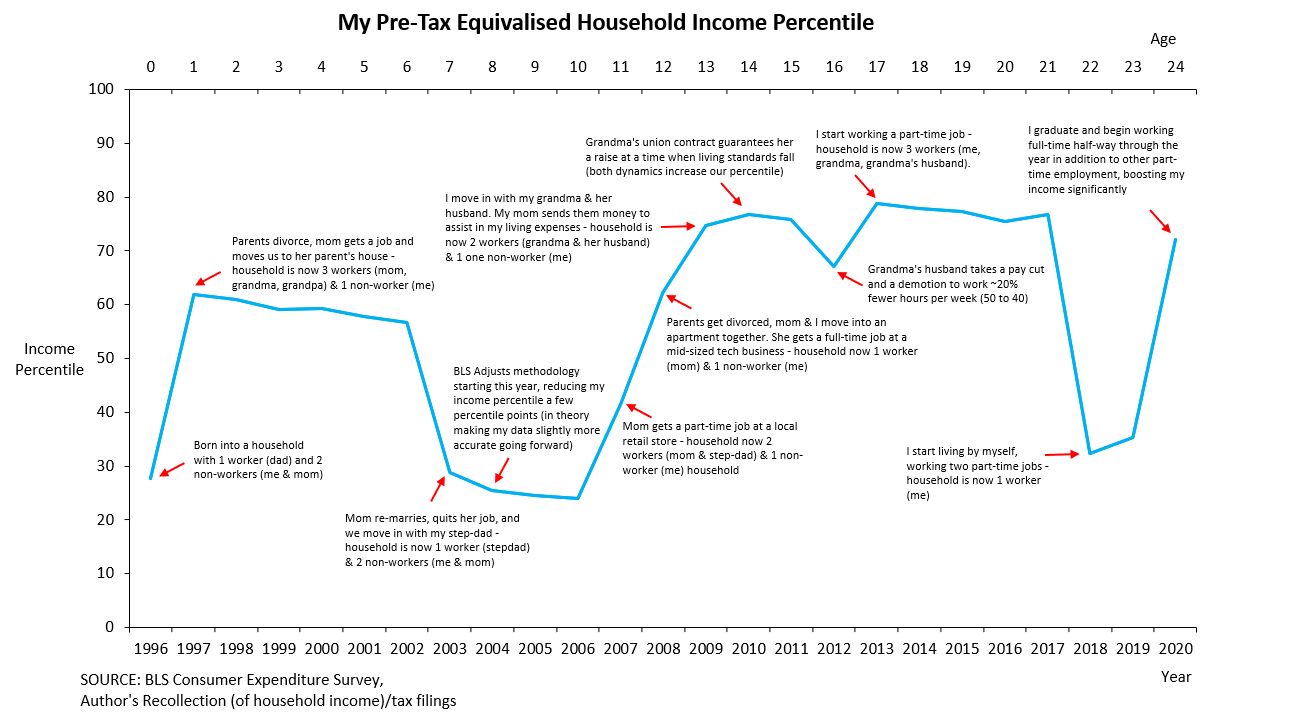
Every single major adjustment (outside the BLS’s methodology change) in my household income percentile came from just a couple of things:
The ratio of workers to non-workers went up or down.
Someone in the household transitioned from part-time to full-time work.
This confirms the theory of poverty I’ve subscribed to for a while, that poverty is mostly a transient phenomenon based on one’s stage in life and their given household composition, and that poverty isn’t strictly tied to one’s pay at their job.
Take, for example, the year I turned 16, when my grandma’s husband decided to take a ~15% pay cut to work 40 hours a week instead of 50. At the time, he made around 57% of our household income. If you asked me at the time, “how much would it lower your standard of living if the primary earner in your house took a 15% pay cut?” I would’ve guessed 10 - 15 percentile points (i.e. from 70th percentile to 60th or 55th percentile).
It turns out it only reduced our relative income level by 8.7 percentile points. This is because we lived in a house with another full-time earner, and my mom gave my grandparents assistance for my expenses, both of which smoothed out this major shock in my grandma’s husband’s income.
People are not usually poor (i.e., very low household income percentile) when they are able-bodied, working full-time, and/or not supporting any dependents. This means the poorest people in society are almost always the elderly/retired, the unemployed, people with disabilities, students, caregivers, and children.
If this is confusing, imagine a single woman working full-time in three different scenarios:
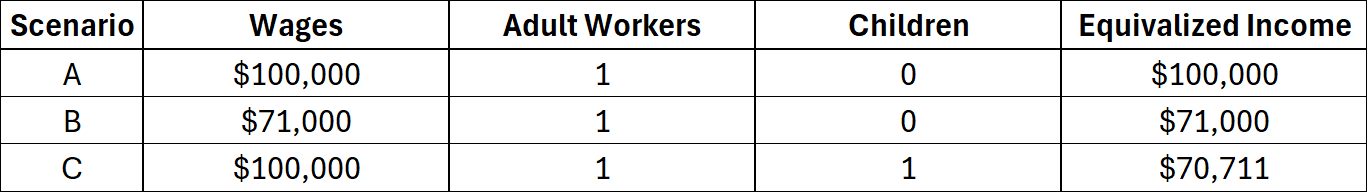
Scenario A is the present. She makes $100,000/year and lives alone (the sole adult in the house). Now imagine Scenario B. Her boss isn’t happy with her work or there are budget cuts, and she receives a massive 29% pay cut. This is devastating for her household finances, but it’s also quite an extreme circumstance.
Companies don’t often cut a worker’s pay by 29%, but people do often have children. In scenario C, we see this woman have a child. Even though her income stays the same, her child absorbs a significant chunk of her income and doesn’t contribute because he’s a lazy and ungrateful newborn. As a newborn, he’s also legally barred from working, leaving less income for each person in the house.
In this case, having a child is equal to an over 29% cut in living standards. This is true up or down. Anytime a non-worker leaves or enters a household or becomes a worker, the household’s income status changes significantly. The same goes for workers entering a household or becoming non-workers.
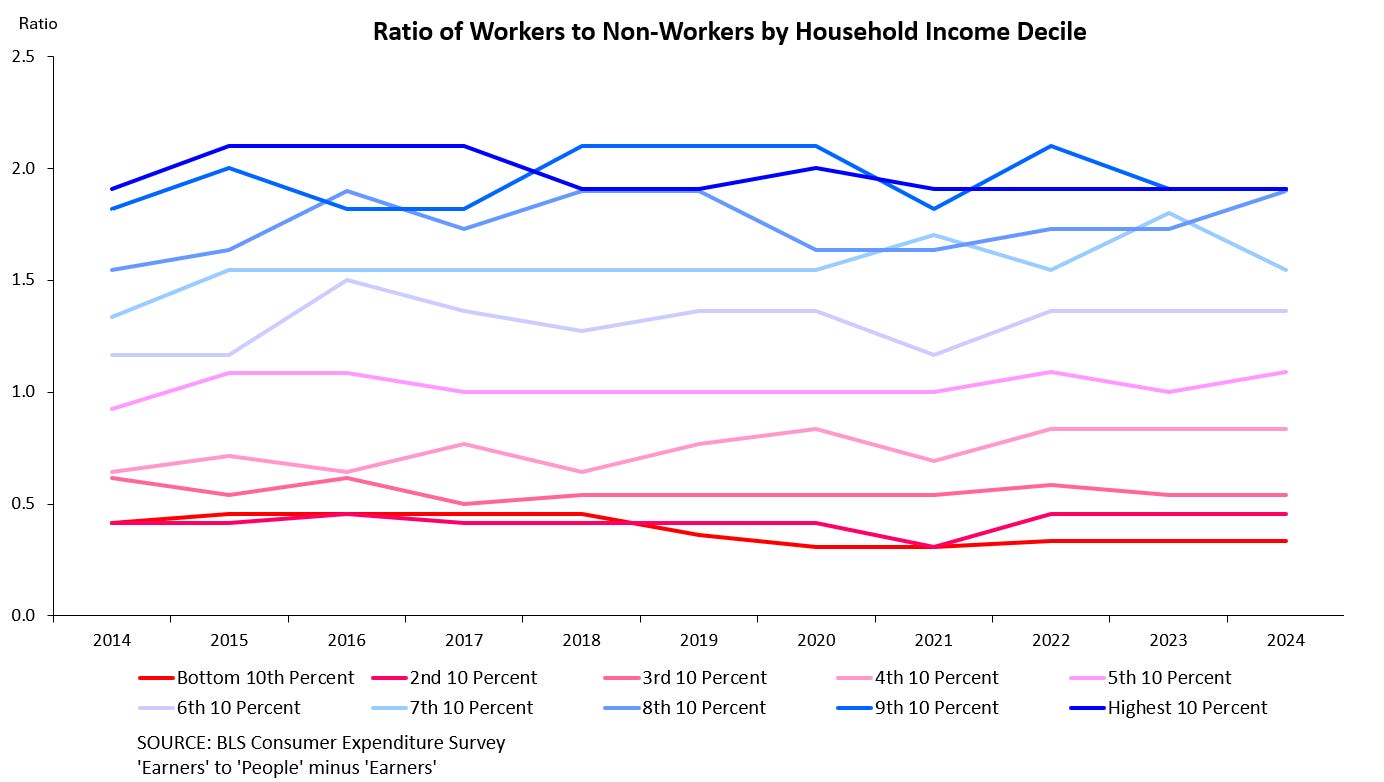
The poorest households, therefore, are typically those households that have a higher ratio of non-workers to workers, independent of the wages of each worker in the household. This trend is remarkably stable.
The times my household’s income percentile went up because of changes in income were each of the separate instances my mom and I transitioned from non-worker to part-time worker or from part-time worker to full-time worker.
This was not a boss recognizing our hard work with a big raise, or us working hard to get a big promotion. Rather, it was us deciding to work significantly more aggregate hours and transitioning to different types of work. My mom went from part-time retail to full-time tech, and I went from not working as a child to menial part-time work to full-time work relevant to my degree after finishing college.
So, why did I feel poor if I wasn’t?
The reason I felt poorer in my early childhood (ages 1 to 5) was that I didn’t appreciate how big a factor the ratio of workers to non-workers in my households played. We lived a conservative life, and we also didn’t need public assistance or credit, nor did we lack basic needs.
The same goes for my teenage years/early adulthood (ages 12 to 21) when I lived with my grandma and her husband, who both worked. The money my mom also sent (a kind of informal child support) to my grandma helped smooth our household’s care expenses when I was a child/adult student. I also started working part-time as soon as I was able to, both legally and practically. These things helped each person in the household avoid poverty.
I also recall feeling poor because during a large chunk of this time I had to balance work and school, when it seemed like most people my age did one or the other. It seemed that way because only 15-20% of teens were doing that during this time.
This time was also very stressful. I did a lot of extracurriculars (which didn’t cost anything out of pocket), took several AP/College courses concurrently with other school electives, and worked 20-30 hours per week, always nights and weekends. The constant stress of balancing my time, saving every penny, and seeing it all go towards an immaterial thing like tuition made me feel relatively poor compared to most of my friends who didn’t do one or a combination of the above. I wasn’t the poorest, but I had less free time and discretionary fun compared to most my age.
I worked so much, in part, because my grandma often reminded me that I was going to be on my own one day, and that student loans are a nightmare to pay off unless you dedicate as much money/planning as possible early in life to minimize this expense later in life, so I always worked.
One other aspect that colored the myth of my teenage years/early adulthood was my grandma. She is very conservative with her money because she grew up very poor (bottom 10%). Her dad worked part-time. Her mom didn’t work, and she had four other siblings all close in age.
To this day, she saves every conceivable penny. Growing up, this meant no frills. We didn’t spend almost anything on vacations, going out to eat, entertainment, etc. Each member of the household had their basic needs covered, like food, housing, and clothing, but everything else was few and far between.
Between having to work relative to my peers, using the vast majority of this money to pay for school and my own needs, and my grandma being a compulsive penny pincher, I felt poor during this period, but that was largely a result of ultra-conservative financial decisions made by the household, and not the result of a genuine lack of resources (income).
One final point—the poorest people are almost always those who can’t work or struggle to work, but most of the reasons for not working or struggling to work are out of the individual’s control. It’s about the household they’re born into, the number of children, and the number of people in the household experiencing old age, disability, or unemployment.
The more voluntary reasons people can’t work or struggle to work are quitting a job, entering an education program, or becoming a caregiver. People might have a free choice to do these things, but for many people, these things seem necessary. My grandma’s husband was entering the last few years of his career, and he didn’t want to work a variable, more than full-time schedule at 63+ years old. I didn’t think going to college/trade school was a choice if I wanted to make good money, and many people think it’s very important to stay at home with their young kids.
It’s implausible to describe any of the rationales above as ‘lazy’ or ‘irresponsible.’ Each of these mindsets is sensible for a person in specific contexts to have. Poverty is something less tied to poor behavior and more tied to the involuntary or understandable structures of a household.
A final note on just how poor many people are
Perhaps the most surprising thing in the results was how low-income I was when I moved out of the house to live on my own during college. I knew I was poor at the time, but I couldn’t have possibly imagined I was as high as the 32nd percentile.
I worked constantly for very little money. One of my part-time jobs paid me a flat monthly rate, but I worked 35 hours a week on average. My other job took about 20 hours a week, and my classes took 30 hours a week on average (between studying, group projects/study sessions, homework, and class time).
Personal Storytime—I started living on my own because I discovered a technicality. One of my part-time jobs was on campus, and all employees in our building had 24/7 access to the building. I happened to have a student office that only I had access to. This was my opportunity to live on campus for free, so I lived in my office.
During this ~18-month stretch, I switched between sleeping on the floor of my office to short stints in a dorm room when I could get another job that paid me in housing for a fixed period (usually 8-12 weeks once a year). Outside of that, it was sleeping every night in my office, storing my clothes and food all over the office (inside cabinets), showering at the gym on campus, and doing most of my morning routine in the office bathroom.
I watched every single penny during this time. At the end of summer 2019, I went from living in a dorm, on my final dorm room contract, to my truck. I didn’t have the job with office access anymore since students could only have that job for one year. I lived in my truck for a couple of weeks before living on my friend’s couch the rest of the year for $250/month plus my share of utilities.
My friend lived in an apartment in one of the poorest, most dangerous parts of town. The apartment itself turned into condemned property within a couple of years of moving out, and we got to deal with many fun aspects of living in a slumlord’s apartment complex in a bad part of town—the appliances worked rarely, gunshots flew nightly, and all sorts of minor/maybe not-so-minor bullshit would accost us. Here are some examples:
One day a guy drove to our apartment complex screaming. We later found out after the police and EMTs arrived that the guy was screaming about his girlfriend sleeping with one of the other guys who lived in the apartment complex. The screaming man broke into their apartment and beat them with a gun until the police arrived.
One day a guy knocked on every single apartment he could until someone (us) allowed him to use our phone to call the police. He had all his utilities cut off because it turned out the person he subleased from was just stealing his rent/utility payments and not actually paying the apartment complex or the utility companies. He then had to abruptly find a different place to live.
The cockroach problem was so bad that every single day I would wake up and immediately feel cockroaches scurry off my body as they sensed me waking up. Of course, the disturbing part is imagining how many crawled on me as I slept, but naturally, the landlord didn’t do anything about this problem. We resorted to covering our entire apartment with a bag of boric acid powder, which we left on the floor in perpetuity.
These are far from all the crazy things that happened, so this is to say that I was struggling deeply with money during this time, and the effects of my income level were very apparent. It was also apparent that every single other person in a 5-mile radius was in a similar boat.
I barely had any money or free time, to the point that I lost 20 lbs from not having the time or money to eat as much. I felt very uncomfortable in my living situation, and I had no idea when or if this was going to end since I was still in school, and there was no telling if my education would pay off or not since I had a two-year stretch of applying and failing to get a decent job.
So what’s so shocking, looking back, is that I was still in the 32nd percentile. I wasn’t starving (I went from 6’1” 220 lbs to 199 lbs), but I seemed to be struggling with every conceivable aspect of economic life. Yet, over 100 million people lived in worse circumstances at the same time. They had dependents. I didn’t. They had disabilities or old age. I didn’t. They only had one part-time job. I had two. I could also do crazy things like live in an office building to save money, an option not advertised to the public (or allowed).
These crazy things allowed me to avoid credit card debt and reliance on charity or public transfer income (like food stamps), and those are some of the biggest dividing lines between the typical 30th percentile household and households in the 10th or 20th percentile.
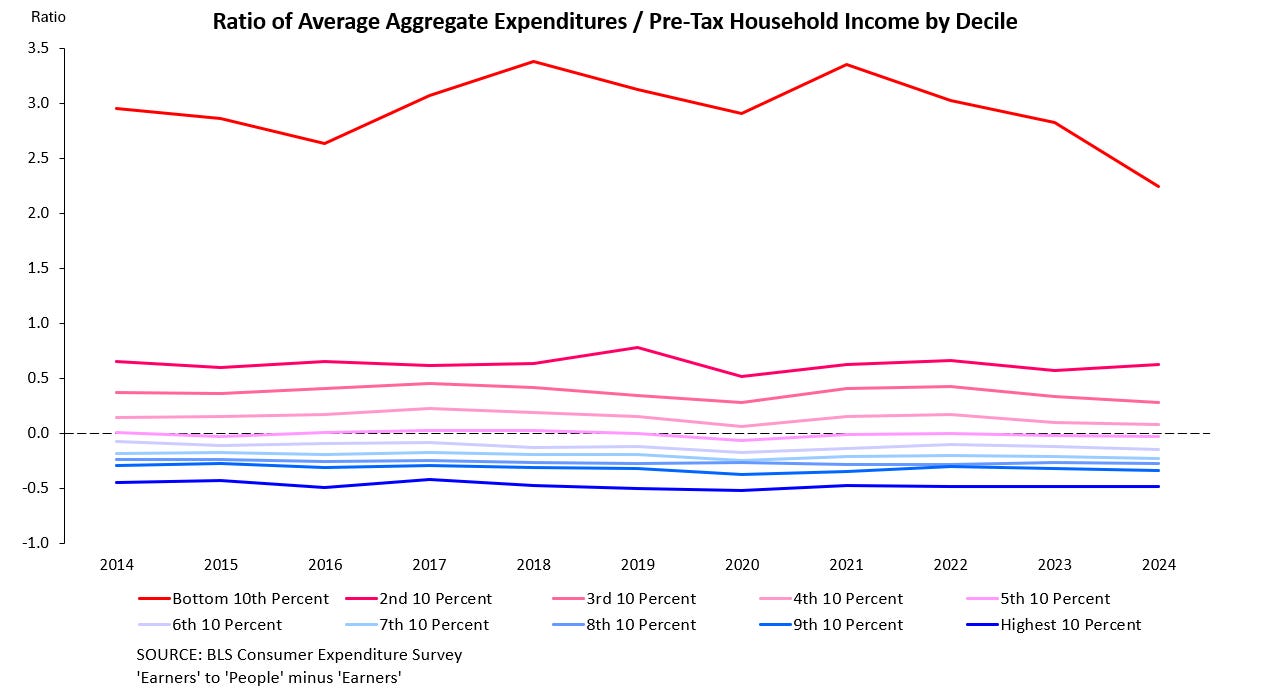
It’s around the 50th percentile when households start earning more than their aggregate expenditures (a proxy for household consumption). This is also roughly the percentile when people start paying into the income tax system and saving more money.
Those in the bottom 10th or 20th percentile often don’t have a choice but to rely on public assistance, the kindness of family/strangers, and/or charity.
So, imagine everything about the daily slog of life I described above, but in addition to it, a spectrum of (1) even less income, (2) the difficulty of applying for/maintaining government benefits/charity and/or begging family/strangers for money, (3) dealing with old age/disability, and/or (4) caring for dependents.
I don’t know if I would’ve had the mental or physical strength to bear adding any of the above to my plate (much less a combination of the above), and that’s the exact spectrum of circumstances 100 million Americans live in.
Thanks for reading.
How did I get these numbers?
I decided to put this in the comments for all you sick freaks who actually care about methodological details. The data here are from the BLS’s ‘Consumer Expenditure Survey,’ with data from 1996 to 2020.
I take the nominal decile figures for pre-tax income and divide that by the square root of each decile’s household size to get the ‘equivalized’ household income for each decile. I do this because it’s a good way to control for household size when thinking about ‘true’ relative income levels. The reason I don’t just divide by total household size (choosing its square root instead) is that households share resources.
Imagine a single person in household A vs. a family in household B. If household B dedicates $700 in income to buy a stove, the same $700 stove enriches all three household members. If the person in household A buys a $700 stove, he only enriches himself. Taking the square root of household size adjusts household B for its shared resources so as to not overstate how much they’re splitting their income between non-shareable resources (like bottles for only the child or a gym membership only for Dad).
Astute readers will have noticed that decile data is only available as of 2014, so in order to get decile-level data pre-2014, I take the nominal quintile data from 1996-2013. Then I calculate the growth rate going backwards in quintiles, so if the bottom 20th percentile was $10,000 in 2014 and $9,800 in 2013, this registers as around a 2% decrease (from 2014 to 2013). Then, I apply this growth rate to 2014’s bottom 10th and 10th-20th percentile data to get 2013’s numbers. I repeat this step for all growth rates and years to get each decile’s nominal income from 1996-2013.
In terms of my own household income, I combined tax return information (as far back as I had available) with personal adjustments I knew existed at the time, like child support payments in or out of the house, personal transfers from family, etc. In years where I don’t have tax data, I use recollection and some rough inflation adjustments to get both my household income and size for each year.
Admittedly, the further back I go, the fuzzier the data becomes, but I tried my best to avoid any gross misrepresentations.
Really enjoyed this!